Performing Analysis Of Meteorological Data
Mar 23, 2021 • 3 views
From the hourly weather data of Finland we can see that the average monthly temperature shows a significant variation through a span of 10 years. The months of July, September and December shows a very sharp change in each year in the given time frame. The data from months of October and November shows inappreciable hike in temperature, tending to almost reduction in the same. Although there are some dips in the temperature data for rest of the months, the trend of the same is going up.
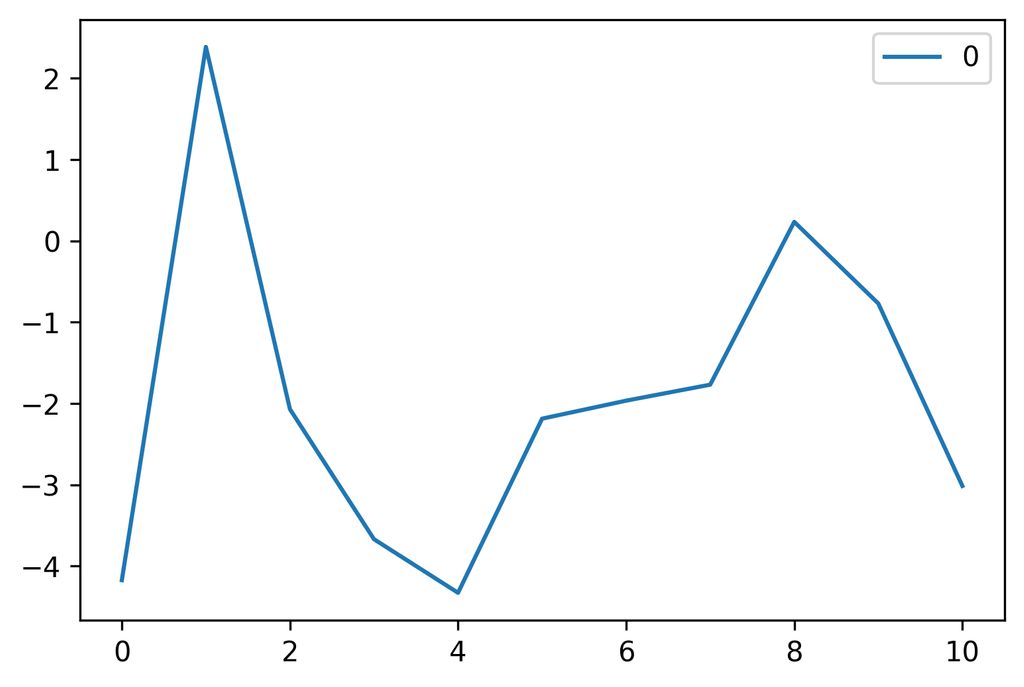
January Apparent Temperature
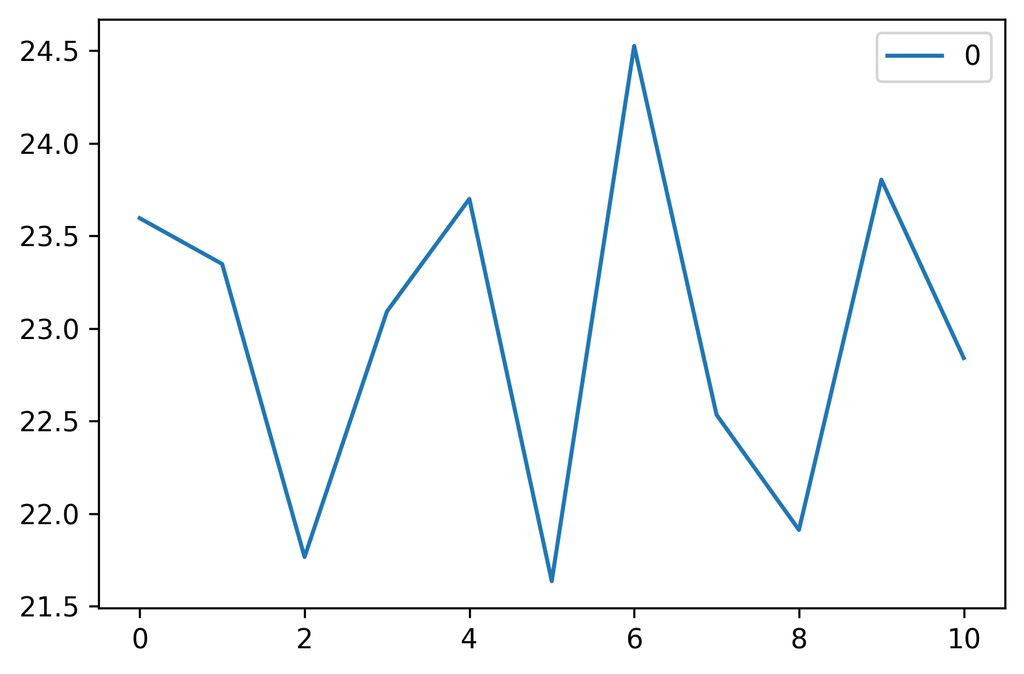
July Apparent Temperature
The lowest temperature for January was -4.1737 degree Celsius and highest 2.387. Similarly, for February it ranges from -8.81 to 4.1507. In July the temperature was high and the highest was 23.595 and the lowest was 21.634.
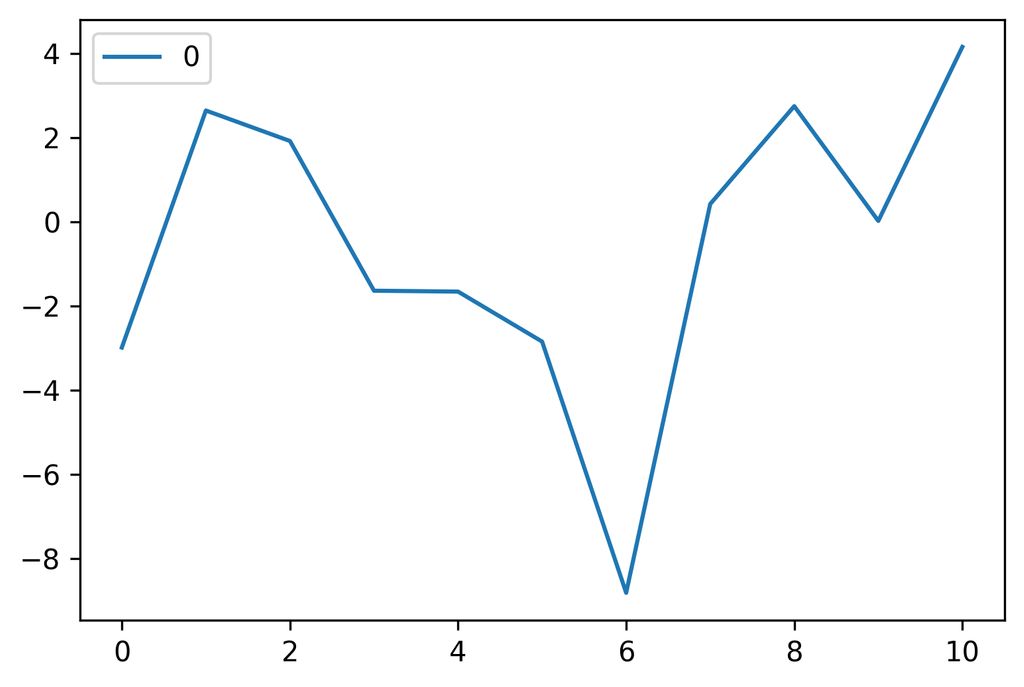
February Apparent Temperature
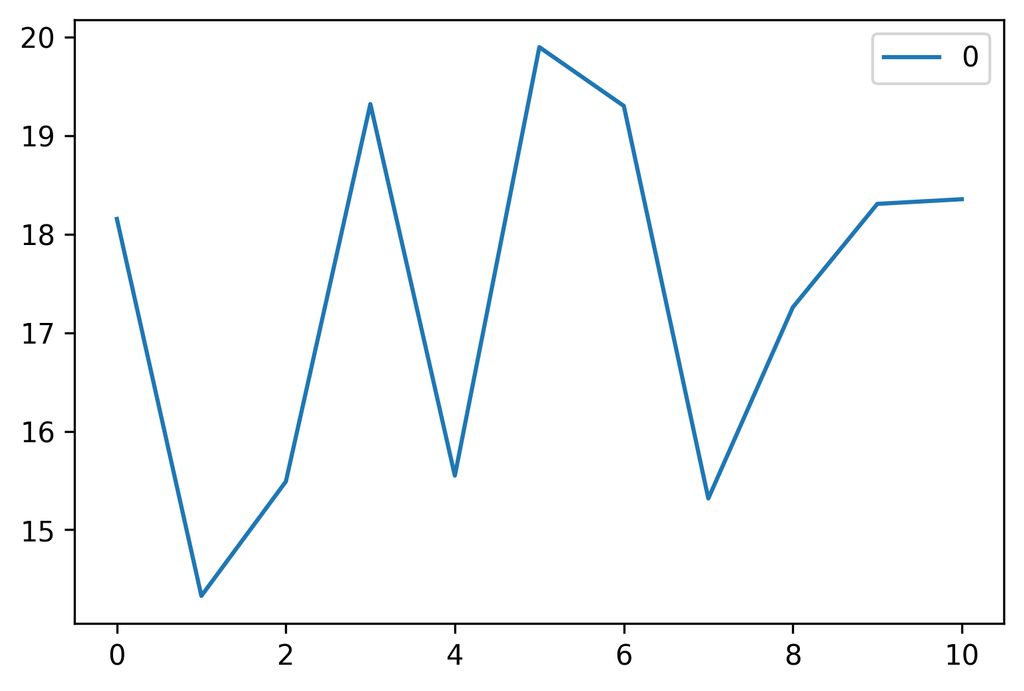
September Apparent Temperature
For humidity data the change follows similar path as temperature, although a little more steep in January, September, October and November. In January the highest humidity was 0.922 and the lowest being 0.813495.
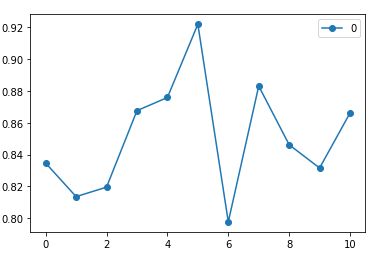
January humidity
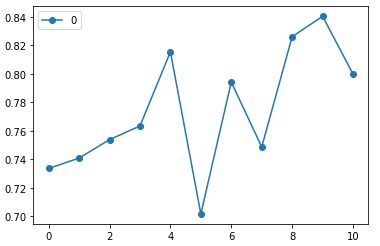
October humidity
In March the average monthly humidity shows a significant fall near 2004, 2006 and 2008 to nearly 0.65, 0.54 and 0.64 respectively.
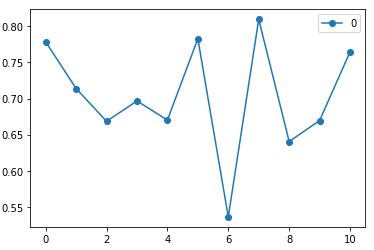
March humidity
