Must Have Indicators For Technical Analysis

Jul 23, 2019 • 13 views
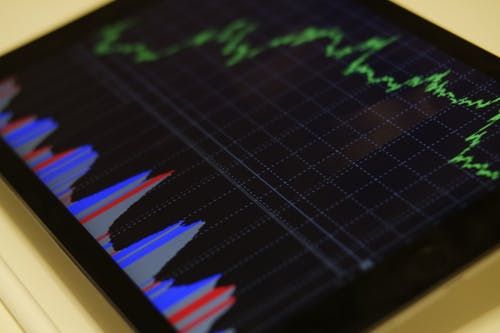
Technical investing refers to a form of financial analysis which observes and records reoccurring patterns in the market data in order to identify trends and make predictions of when to buy or sell a stock. Technical indicators are mathematical models which observe various parameters affecting the stock price (such as volume, interest) etc. and are used in Technical Analysis. There are 4 major types of Technical Indicators:
1)Trend
We will now be examining some of the best indicators used in technical analysis and what they mean.
1) MACD
The MACD or the Moving Average Convergence Divergence is a commonly used trend indicator which provides both the direction of the trend as well as the momentum of the trend line. It consists of 2 lines which indicate the different moving averages of different time periods. One line is the MACD line and the other is a slower signalling line. While there are many complex mechanics behind it, the simplest thing to keep in mind is that if the MACD line falls below the signal line, the indicator is below zero, the price is predicted to fall & if the MACD line crosses above the signal line, indicator is above 0, the prices are expected to rise.

2) Relative Strength Index
The Relative Strength Index is another extremely useful indicator, plotted on a single line scale ranging from 1 to 100. The primary use for this indicator is to measure overbought or oversold shares and hence predict trend changes. If it reads above 70, the share is considered overbought (should sell) and if it reads below 30, the share is considered oversold (should buy).

3) The Average Directional Index
The Average Directional Index, or ADX, is another indicator which is measured on a scale from 1 to 100. The ADX’s main feature is in identifying the strength of the current trend. Below 20 and the trend is considered weak and might change, while above 50 means the trend’s momentum is likely to continue. The ADX cannot however tell you what direction the trend is in and hence is better used in conjunction with other indicators.

4) Accumulation / Distribution Line
This indicator measures the money flowing in and out of a security, as well as taking account the volume of the trades. It slopes up when there is more money flowing into the security, hence showing if there is more interest in the security and slopes down when there is money flowing out of the security.
These are just some of the major Technical Indicators most Investors should consider adding into their arsenal and should be aware of.
Recommended

Kasam Ki Kasam Chords - A.R.Rahman & Shaan - Kabhi Khushi Kabhi Gham